
Monitoring tools do not have to be engineer-only. They can be customized for executive assistants and management.
Fully real-time alerting combined with AI-assisted log analysis enables detailed operational insight without relying on individual expertise.
Zabbix as the Core Monitoring Platform
This approach reduces operational risk while preserving full transparency of monitoring data.
Our monitoring architecture is built around
Zabbix, an open-source enterprise monitoring platform used globally in data centers and corporate networks.
Zabbix allows us to implement:
- Server monitoring
- Network monitoring
- SNMP monitoring
- Syslog monitoring
- SLA visualization
- Custom dashboards
- Real-time alerting
Because Zabbix is open-source and vendor-neutral, the monitoring environment remains transparent and maintainable over the long term.
Monitoring Designed for Non-Engineers
Traditional monitoring systems are often designed only for engineers and require deep technical interpretation.
We redesign Zabbix dashboards so they can be used by:
- Executive assistants
- Operations coordinators
- Management teams
Dashboards can display:
- Service health indicators
- Site availability
- Critical alert counts
- Monthly uptime metrics
- Simplified status panels
This enables:
- First-line monitoring by non-engineers
- Clear escalation procedures
- Reduced operational overhead for executives
Monitoring should support decision-making, not burden leadership with technical interfaces.
Real-Time Alerting
Zabbix supports fully real-time detection and notification.
Typical monitoring targets include:
- VPN status
- WAN latency
- Packet loss
- Server resource usage
- Network device status
- Routing events
Alerts can be delivered through:
- Chat systems
- Webhooks
- Notification gateways
This ensures that incidents are reported immediately rather than discovered retrospectively.
AI-Assisted Log Analysis
Real-time alerts alone are not sufficient if log interpretation depends on a specific engineer.
Our approach combines:
- Standard CLI log retrieval
- Plain-text log storage
- AI-assisted analysis when required
Typical workflow:
- Zabbix detects an anomaly
- Secure login to the device
- Execute standard log command
- Retrieve plain-text logs
- Analyze manually or with AI assistance
By keeping logs in readable text format, the system avoids dependency on proprietary parsers or custom software.
AI assistance allows:
- Rapid summarization of large logs
- Identification of critical events
- Pattern recognition
- Report preparation
This significantly reduces operational dependency on individual engineers.
Reporting Capabilities
The monitoring environment can generate structured reports using:
- Graphs
- Availability statistics
- Alert summaries
- Performance trends
Reports can be delivered in:
- PDF format
- Graph-based summaries
- Executive reports
- Periodic operational reviews
These reports help management understand:
- System reliability
- Incident frequency
- Infrastructure trends
- Operational risk
without requiring technical interpretation of raw logs.
Maintainability and Transparency
We intentionally avoid proprietary monitoring systems that create long-term vendor dependency.
Instead, we design monitoring environments based on:
- Open-source platforms
- Standard protocols
- Human-readable logs
- Transferable operational procedures
This ensures that the monitoring system remains understandable and maintainable even if personnel change.
Monitoring systems should remain operable and auditable for years, not just during initial deployment.
Scalable Architecture
The same monitoring design can scale from:
- Small offices
- Multi-site enterprises
- Data centers
without requiring replacement of the core platform.
Because Zabbix does not rely on per-device licensing, the system can grow without exponential cost increases.
データセンター監査: 経営幹部とそのアシスタントチームによって実施
Deterrence created when a CIO visually inspects each individual connection
To maintain a visible on-site presence and keep operations disciplined.
To ensure that negligence or sabotage does not go unnoticed.
When conducting a data center audit, the external appearance—particularly the cable routing and termination—will likely become the central focus of the inspection.
In many of the data centers we have been involved with, we have witnessed “severely problematic” cabling on two occasions over the past 20 years.
(The example shown here is a simplified reproduction created within an environment under our supervision.)
First, we present an example of incorrect cabling.
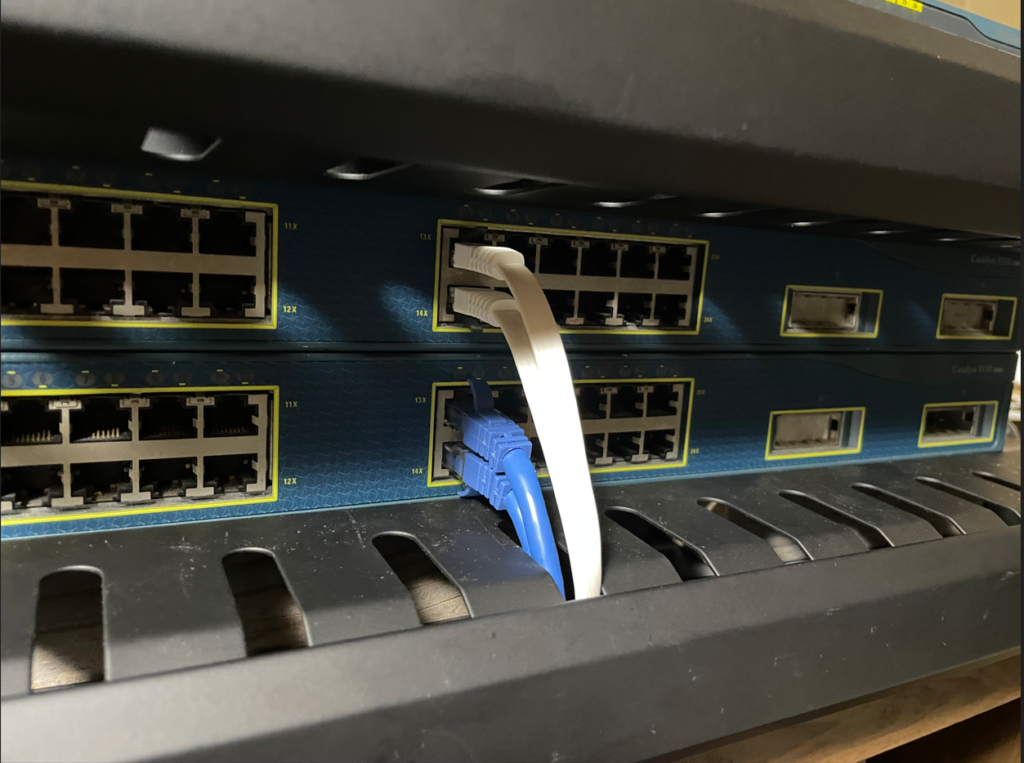
Reason this is incorrect:
If the lower device fails, the upper device would also need to be removed in order to access it.
If these two units are configured in a redundant pair, both the primary and secondary systems would end up being removed together.
Although the number of cables in this sample photo is limited, most machines in commercial operation typically have a much higher cable count.
If the number of cables is low, it often means that the cost of each available port is being underutilized.
Site inspections conducted by executive leadership should also incorporate a cost-efficiency perspective.
Next, we present an example of proper cabling.
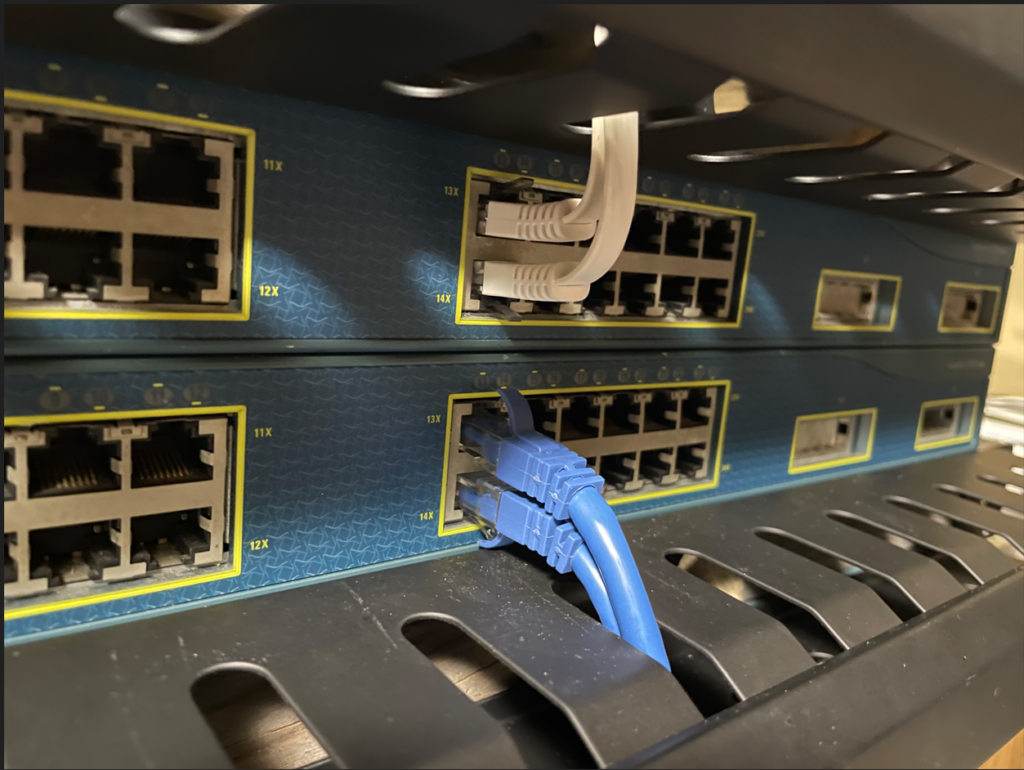
With this approach, either the primary or the secondary unit can be replaced independently in the event of a failure.
コメントを残す